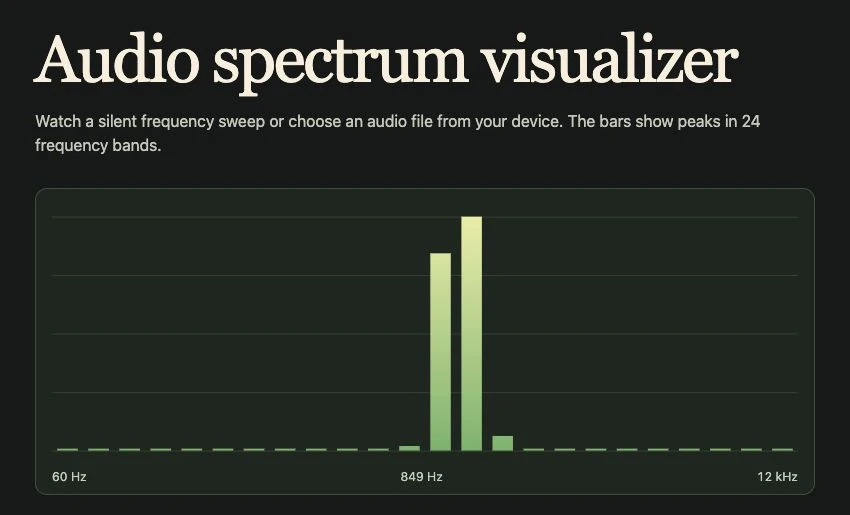
To build an audio visualizer with HTML, CSS, and JavaScript, connect an audio element to a Web Audio API AnalyserNode, read its frequency data, and draw one bar per frequency band on a 2D canvas. HTML provides the file picker and controls. CSS sizes the plot, and JavaScript updates it as the audio plays.
Open the working audio spectrum demo and choose Run silent sweep. The highlighted bands travel from low to high as the test frequency rises. You can also select a local audio file and choose Play file. Turn on Mute file playback to watch the bars with the speakers silent. The demo is a single HTML file. Use your browser’s Save Page As command to keep a copy you can edit.
1. Connect the player and the analyser
Create the AudioContext from a button handler and resume it before playback. Use one media source node for the audio element and keep that node when you change files. To load a selected file, set the element’s source to an object URL from URL.createObjectURL(file). Revoke the previous URL when you replace it.
The demo connects the analyser before a gain node so it can measure the signal even when speaker output is zero.
const audio = new AudioContext();
const analyser = audio.createAnalyser();
analyser.fftSize = 4096;
analyser.smoothingTimeConstant = 0.62;

const output = audio.createGain();
audio.createMediaElementSource(player)
  .connect(analyser);
analyser.connect(output)
  .connect(audio.destination);

const bins = new Uint8Array(
  analyser.frequencyBinCount
);
The player is the HTML audio element. The full demo calls audio.resume() inside its playback and sweep handlers. It sets output.gain.value to zero for the silent sweep and for muted file playback.
2. Turn frequency bins into bars
getByteFrequencyData() fills the array with values from 0 to 255. Each array index represents a frequency bin, and the distance between bins is audio.sampleRate / analyser.fftSize hertz. An FFT size of 4096 gives you 2048 bins. At a sample rate of 48 kHz, adjacent bins are about 11.7 Hz apart.
Drawing 2048 separate bars would make most of them too narrow to see. The demo groups bins into 24 logarithmically spaced bands, normally covering 60 Hz to 12 kHz. Logarithmic spacing gives the lower frequencies more room on the chart. For each band, take the strongest bin and scale its byte value to the height of the plot.
analyser.getByteFrequencyData(bins);

for (let band = 0; band < bands.length; band++) {
  const [first, last] = bands[band];
  let peak = 0;
  for (let i = first; i < last; i++) {
    peak = Math.max(peak, bins[i]);
  }
  levels[band] = peak;
}
These heights represent the analyser’s scaled frequency data. A bar’s position tells you which range it represents, while its height tells you how strong the signal is in that range. For a trace of the signal’s amplitude over time, read time-domain samples and draw a line. The waveform and spectrum guide shows how those two views look with the same recording.
3. Draw and check the animation
Read and draw a new set of bars with requestAnimationFrame(). The demo clears the plot each frame, then draws each bar from the bottom up. It also cancels the animation loop when playback pauses or the sweep stops. A ResizeObserver updates the canvas drawing size when the visible plot changes size.
Run the sweep first. Low bands should light up near the left edge, and the peak should move right. Then play a file you know and watch a quiet passage and a loud one. If the bars stay flat, check that playback started, the context is running, and the source connects to the analyser. If you later switch to a remote audio URL, check that the host allows cross-origin media analysis. The local-file demo needs no remote audio URL.
If the goal is a release video
This example draws a live chart in a web page. To save a timed MP4 with artwork and a soundtrack, follow the music visualizer video guide or explore VisualizerWave. The VisualizerWave editor handles the video render and encode.