An audio waveform visualizer draws the audio signal's amplitude over time. A frequency spectrum shows how that signal is distributed across frequencies. Choose a waveform when you want a continuous signal-driven line, spectrum bars when frequency movement matters, and a stereo scope when you want the relationship between the left and right channels to determine the shape.
The right choice also depends on your output: an animated release video, a still waveform image, or an analysis view. This guide compares the visual styles for a music video, using four actual VisualizerWave exports from the same original recording. It also explains where creative visuals differ from measurement tools.
Waveform versus spectrum at a glance
| Display | What determines the drawing? | Useful when you want… |
|---|---|---|
| Waveform | Signal amplitude across a time window | A continuous line that follows the recording |
| Frequency bars | Magnitude in frequency bands | Visible separation between lower and higher frequencies |
| Radial spectrum | Frequency information arranged around a center | A moving frame around artwork or a logo |
| Stereo scope | Left and right channel samples mapped to a path | A trace shaped by the relationship between channels |
A line is not automatically a waveform, and a circle is not automatically a spectrum. The source data and drawing method matter more than the outline. A generated shape can respond to audio level without tracing the signal itself.
What does an audio waveform show?
A waveform's horizontal axis represents time; its vertical axis represents amplitude. Signed sample values move above and below a zero center line. Larger excursions mean a larger signal amplitude at those moments, rather than a direct measurement of perceived loudness.
There are two common presentations:
- A whole-track waveform summarizes a recording across its duration. Zoomed-out displays often summarize many samples into an envelope, which helps locate phrases, pauses and transitions.
- An animated short-window waveform repeatedly shows a small section around the current playback moment. You can see rapid oscillations inside a sound, rather than the whole song stretched across the screen.
In VisualizerWave, Waveform Ribbon uses a real mono waveform with multiple strands and gentle decorative drift. It is a creative interpretation of the signal, with no calibrated time or amplitude axes. The waveform animation walkthrough shows how to adjust its movement, scale and position without covering the title.
For dialogue, the podcast visualizer guide demonstrates a readable composition with cover art and a waveform during speech and pauses.
What does an audio spectrum show?
A frequency spectrum separates a short section of audio into frequency components. In a conventional horizontal display, frequency runs from lower to higher values along the horizontal axis, while the vertical axis shows magnitude or level according to the chosen scale.
Hertz (Hz) measures cycles per second. A lower tone and a higher tone can appear in separate regions of a spectrum even though both contribute to one complex waveform.
Here is a labeled example calculated from the left channel of our original test recording:
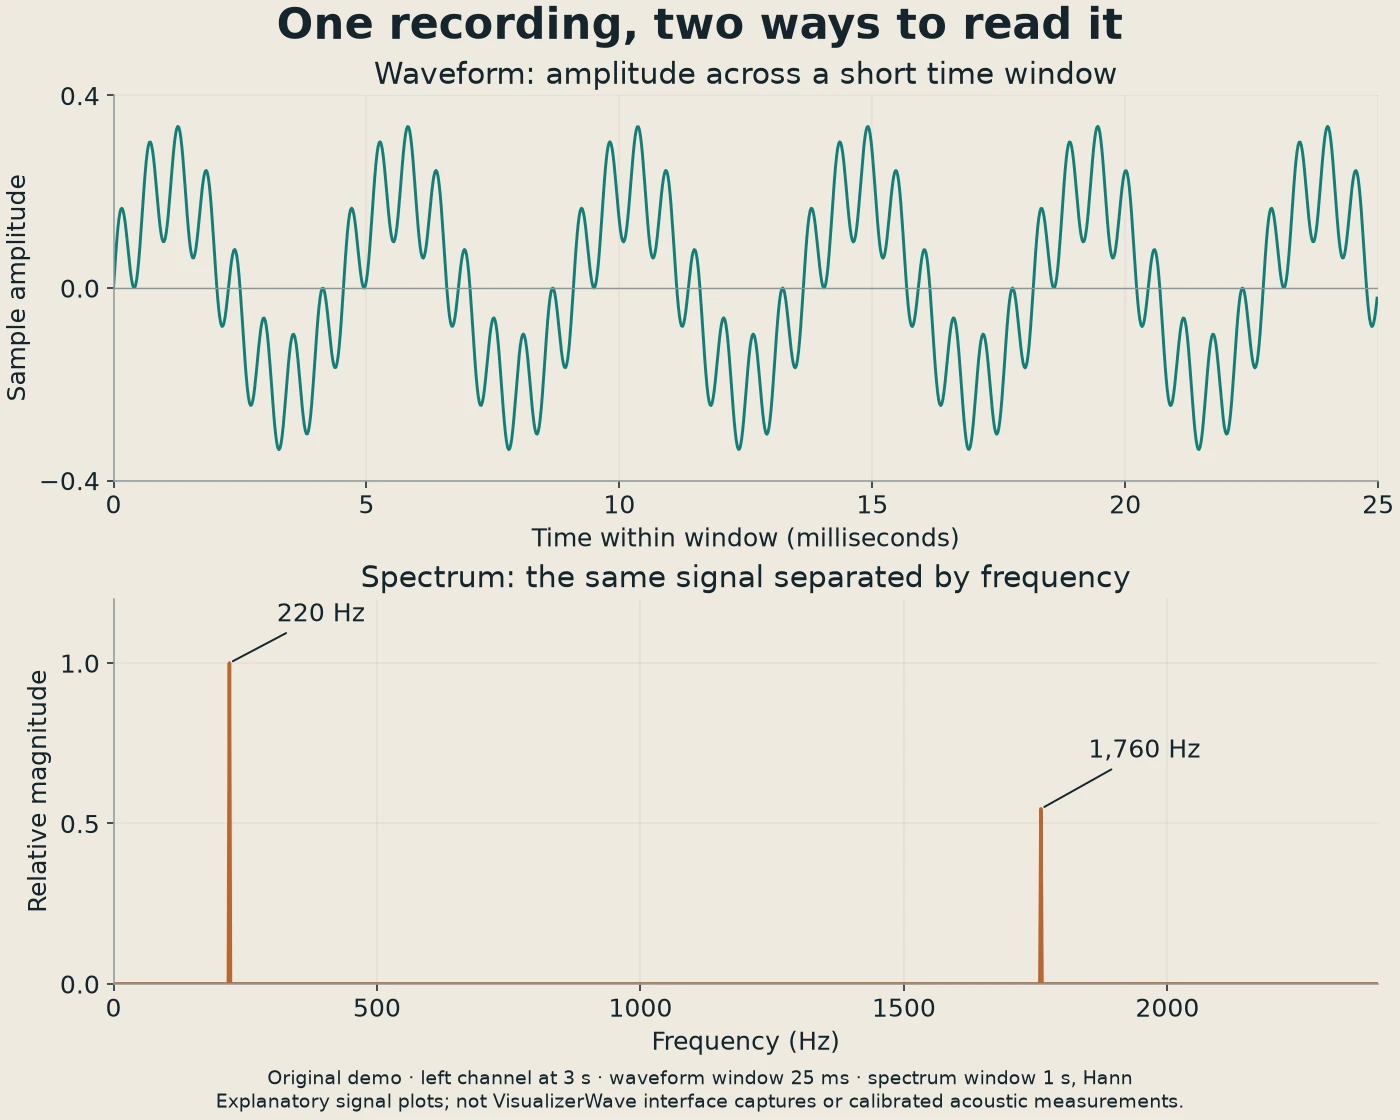
Top: a 25 ms waveform window. Bottom: a spectrum calculated from a one-second segment at the same part of the recording, using a Hann window. Its largest magnitude is normalized to 1. These are explanatory plots of the source audio, not product interface screenshots or acoustic measurements.
The waveform contains the combined signal. The spectrum makes the two sine components—220 Hz and 1,760 Hz—easier to distinguish. They are deliberately simple teaching signals; a real mix can contain many overlapping components and changing transients.
A spectrum does not automatically identify the instrument playing each frequency. A bass-focused range can include both a kick and a bassline. Nor does a tall bar tell you that the track sounds better: gain, normalization, smoothing and the display range all affect its appearance.
For a horizontal frequency-based composition, the minimal line visualizer guide demonstrates a mirrored spectrum with room for the title.
Compare four styles using the same audio
We created one eight-second stereo WAV and used it for all four exports:
- 0–2 seconds: a 220 Hz tone, matching in both channels.
- 2–4 seconds: a 1,760 Hz component joins it, with a phase difference between the channels in that higher component.
- 4–6 seconds: the same two components at half their preceding amplitude.
- 6–8 seconds: silence.
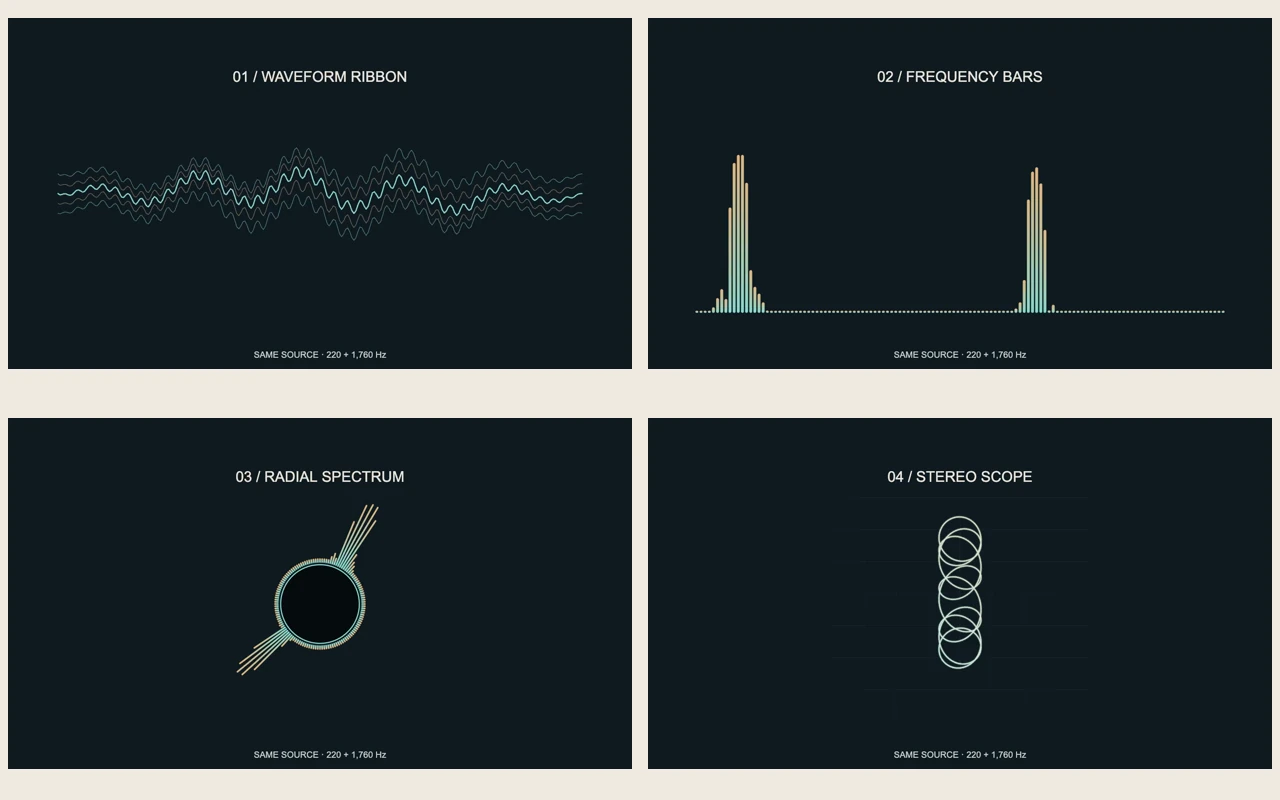
The cover image shows all four styles at 3.1 seconds. The silent animations below show the complete visual sequence. Each was rendered at 1280 × 720, 30 fps through VisualizerWave. Their audio tracks have been removed so you can focus on the motion.
Waveform Ribbon
The line's fine detail changes when the second component joins the signal. The strands retain their decorative drift during silence.
Frequency bars
A second region becomes active with the higher component. The small baseline remains even without sound.
Radial spectrum
Frequency activity is arranged around the ring rather than along a horizontal row.
Stereo scope
Matching channels form a vertical trace. The channel difference opens the shape, and the trail fades after the source stops.
This comparison uses one recording, not one universal visual scale. Each style maps the data differently; their heights and brightness cannot be compared as loudness readings. Even a quieter section can still produce strong spectrum bars because of the frequency display's scaling.
In this test, the bars and radial use 128 bars, Movement 1, Smoothing 0.5 and the same selected frequency range. The ribbon uses Movement 1.1; the stereo scope uses Stereo field · vertical, Beam gain 1.8 and Phosphor trails 0.12. The radial is reduced to Scale 0.8 to leave space for its label. Beat zoom, shake and scene post-processing stay off.
These are locally tested product outputs with explanatory labels. They are not calibrated analyzers, and the demonstration settings are not recommendations for every track.
When a radial spectrum is the better composition
A radial spectrum wraps frequency activity around a center point. It can frame square cover art while keeping the artist's identity central. That is a layout decision: arranging frequency information in a ring does not turn it into a time-domain waveform.
Leave room for the ring's longest outward movement. A quiet intro can make a cover fit seem safe even when a strong passage pushes the animation across surrounding text. Follow the circle audio visualizer tutorial for a worked cover-and-ring layout.
What does a stereo oscilloscope-style visualizer show?
An oscilloscope can display a signal against time, or map two signals to separate axes. The chosen view changes what the path means.
VisualizerWave's Stereo Scope offers a channel-driven trace. In Stereo field · vertical, matching channels produce a vertical line; differences between them can open the shape sideways. Left / right XY maps the left channel to the horizontal axis and the right to the vertical axis. Dual waveforms shows both channels separately across time.
A straight trace is not automatically a fault, and an open shape is not a quality score. It reflects the input and view. The oscilloscope music visualizer guide explains the views, beam and trails, including why mono can become a line.
Is a visual equalizer the same as audio EQ?
The phrase visual equalizer is used for several different things. A spectrum animation displays activity. An audio equalizer boosts or cuts parts of the sound's frequency spectrum. An EQ plugin can contain both a spectrum analyzer and controls that change the audio.
In VisualizerWave, changing a visualizer's Movement, Smoothing, Scale or frequency focus changes the visual response. It does not apply corrective EQ to the exported soundtrack. If you want less bass in the recording, make that audio change in an audio editor or DAW before importing the revised file.
For analysis, use a tool with the units, scale and measurements your task requires. A spectrogram is another view: it shows frequency content changing over time, often using color for intensity. It is useful for inspection, but it is different from a decorative row of bars. The Sonic Visualiser comparison explains the distinction between studying a recording and making a release video.
Choose your visualizer by the result you need
- An understated music or voice clip: try a waveform, then adjust its placement around the title.
- A beat-driven release: try spectrum bars if you want lower and higher frequency activity to read separately.
- A cover-centered composition: try a radial spectrum and check its strongest movement around the artwork.
- A channel-driven trace as the main subject: try Stereo Scope and preview several moments of the actual stereo file.
- A printable waveform or a technical analysis: choose a tool built for that deliverable. Do not assume a video visualizer also provides static SVG output or calibrated measurements.
Create a visualizer video in VisualizerWave
If you produce in FL Studio, the Wave Candy and ZGameEditor comparison helps you choose between a live monitoring view, a native video render and a finished WAV sent to a browser editor.
Import your finished recording, choose the visualizer style, then add the artwork and title. Preview a quiet section, a strong section and a transition before exporting. Available controls depend on the style: Waveform Ribbon uses the full mix and has no smoothing control in the contextual inspector; frequency-reactive styles provide different response options.
The music visualizer setup guide covers the complete workflow. Run the compatibility test and export a short section first to check the format supported on your browser and device.
VisualizerWave processes the audio and renders video on your computer. It is a paid video-making tool: $19 once, with unlimited exports. MP4, WebM and higher-resolution options depend on browser and device support.