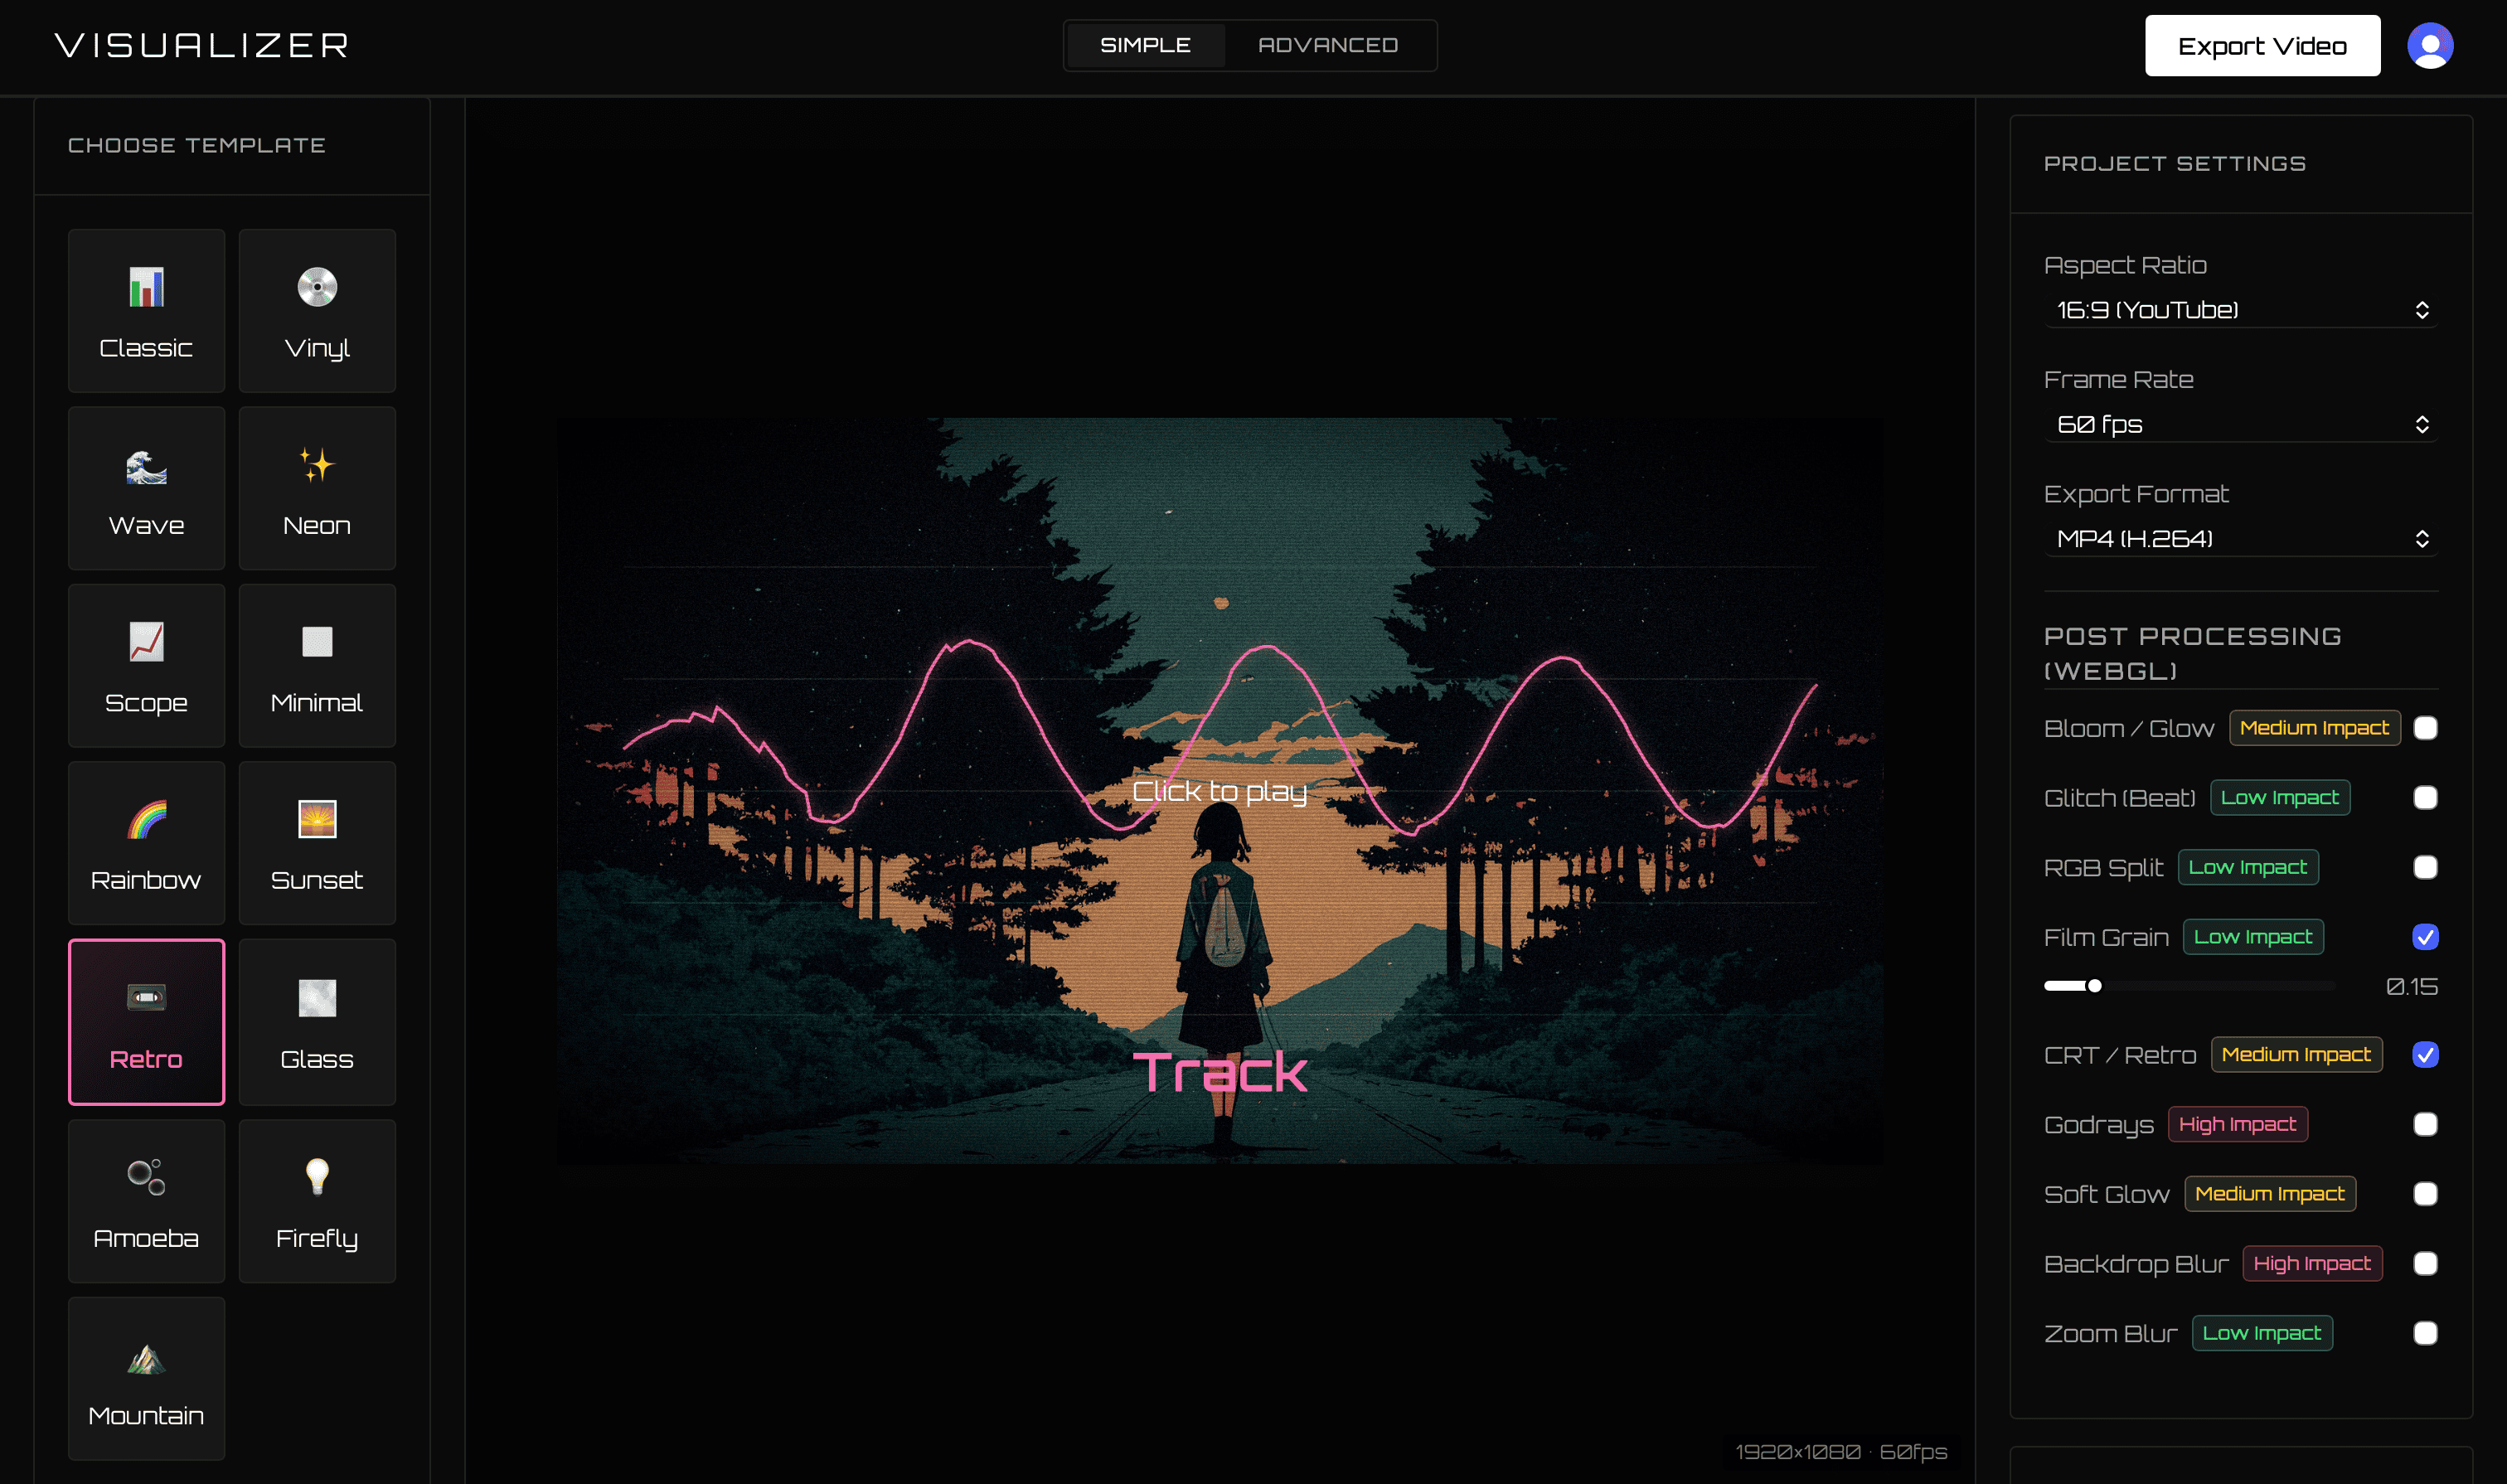
Sonic Visualiser and VisualizerWave share a word in their names, but they solve different problems. Sonic Visualiser is for studying, annotating, and measuring recordings. VisualizerWave is for turning music into finished audio-reactive videos.
If you want a YouTube visualizer, Spotify Canvas, Reel, or type beat video, VisualizerWave is the correct tool.
Comparison last checked September 2026 using the official Sonic Visualiser website and feature documentation.
VisualizerWave vs Sonic Visualiser
| Feature | VisualizerWave | Sonic Visualiser |
|---|---|---|
| Pricing | $19 lifetime | Free and open source |
| Primary purpose | Publish-ready music visualizer videos | Detailed audio analysis and annotation |
| Video export | MP4 and WebM up to 4K | Not designed as a music-video exporter |
| Visual style | Branded waveforms, spectra, radials, effects, and artwork | Scientific waveforms, spectrograms, plots, and annotation layers |
| Social formats | 16:9, 9:16, 1:1, and 4:5 | Not a social-video layout tool |
| Audio analysis | Release-focused frequency response | Deep measurement, annotation, and plugin extraction |
| Processing | Local browser processing | Local desktop processing |
| Best use | Promoting and publishing music | Researching and studying recordings |
Pricing is not the real decision here
Sonic Visualiser is free under the GNU GPL. VisualizerWave costs $19 once. On price alone, the free application wins—but it does not create the same deliverable.
Sonic Visualiser’s official site describes software for musicologists, archivists, signal-processing researchers, and people who need to inspect a recording closely. Its features include spectrograms, annotations, time-aligned layers, pitch and beat extraction plugins, and measurement tools.
VisualizerWave’s paid value is the complete video workflow: artwork, titles, beat-reactive graphics, effects, social layouts, and encoded files ready to publish.
Analysis views are not release visuals
A scientific waveform or spectrogram helps you understand what is inside a recording. It is not automatically a branded music video.
VisualizerWave turns the audio response into a designed composition:
- Add cover artwork, artist name, and track title.
- Choose waveform, spectrum, radial, bar, or oscilloscope templates.
- Adjust reactivity, smoothing, and frequency focus.
- Add beat zoom, shake, glitch, bloom, and other treatments.
- Export the correct aspect ratio for the destination.
The result is intended for an audience, not an analysis session.
Both tools respect local computing
Sonic Visualiser runs as a local desktop application. VisualizerWave processes media locally inside the browser. In both cases, demanding audio work uses the customer’s computer.
VisualizerWave extends that local-first approach through the final video render and portable project packaging, keeping unreleased masters outside a VisualizerWave cloud-rendering service.
Choose by outcome
Choose Sonic Visualiser when you need to inspect spectrogram detail, annotate time points, compare layers, measure audio features, or run research-oriented extraction plugins.
Choose VisualizerWave when you need:
- A finished music video rather than an analysis screen.
- 4K MP4 or WebM output.
- Artist branding and cover artwork.
- Beat effects and post-processing.
- Social-media aspect ratios and unlimited exports.
Sonic Visualiser is excellent at analysis, but it is not a substitute for a release-video maker. VisualizerWave is the better publishing tool because it is designed for that job from the first screen.
Create publish-ready music visuals for $19 once.
Sonic Visualiser is a trademark of its respective owner. VisualizerWave is not affiliated with the Sonic Visualiser project.