If your audio visualizer bars are not moving, first check that the intended audio file is loaded and playback is advancing through a passage containing sound. Then check the visualizer layer's visibility, frequency focus and response settings. Bars can look almost still when they are following a frequency band with little energy, even though the song is playing correctly.
In VisualizerWave, start a frequency-bars check with React to → Full mix. If the bars respond, narrow the frequency focus afterward. If they remain near their baseline, check smoothing and quiet-audio response one setting at a time. The examples below reproduce those branches using the current native analyzer and renderer.
Find which part has stopped responding
Watch the playhead and the picture separately. Hearing music elsewhere on your computer does not establish that a file-based video editor has loaded that music. Likewise, a waveform overview can stay drawn while playback is paused; it is not a live spectrum.
| What you see | First useful check |
|---|---|
| The playhead is stopped | Start playback and check a passage inside the loaded recording |
| No visualizer is visible | Check the layer's visibility, position, size and whether artwork covers it |
| Bars stay near a baseline while the song plays | Try Full mix, then inspect smoothing and sensitivity |
| Only quiet passages show little movement | Compare the same passage in Standard and Auto response modes |
| Bars move, but look different from an expected waveform | Check whether you chose a frequency spectrum or a waveform style |
| The picture moves but the saved video has no sound | Check the saved file's soundtrack and selected source range |
The last case has its own no-sound export guide. Increasing the bars' sensitivity changes the picture; it cannot add a missing soundtrack.
Confirm the loaded source and playback
Load your intended song through Media → Upload Audio File, then preview a section you know contains music. Check the file version as well as the playhead: a silent intro, tail or gap can be a valid part of an otherwise audible recording.
In VisualizerWave's video-making workflow, a background video provides the picture and its embedded audio is muted. Load the soundtrack separately as project audio. Imported MIDI supplies note events rather than an instrument recording; it also needs the corresponding audio for a soundtrack.
We checked the real audio store in a local diagnostic view. With a file loaded and paused, its time stayed at 0.50 seconds. After starting playback, time advanced and frequency data became available. Pausing held the new time steady. That confirms the distinction between a loaded source and advancing playback in this check; it does not test every browser or physical audio output.
If audio fails to load or playback does not start, use the compatibility and troubleshooting page before adjusting the visual design.
Show the visualizer layer before changing its response
Select the visualizer layer in the layer list. Its visibility control changes between Hide and Show followed by the layer name. If it offers Show, make the layer visible and preview again.
Check that the bars are inside the canvas and large enough to see. Inspect any image or video layer that could obscure them. A hidden or covered layer can resemble a failed audio response, but a sensitivity adjustment cannot make an omitted layer render.
Our native scene check also compared visible and hidden versions of the same bars. The hidden version was omitted from rendering even though the source still supplied frequency data. We tested that rendering behavior; we did not reproduce every possible arrangement of overlapping artwork.
Try Full mix: the selected band may contain little signal
For frequency bars, open Music response and find React to. In the contextual inspector, expand More controls if needed. The available targets include Full mix, Bass, Mids and Highs. Use Full mix as a diagnostic starting point, then replay the same passage.
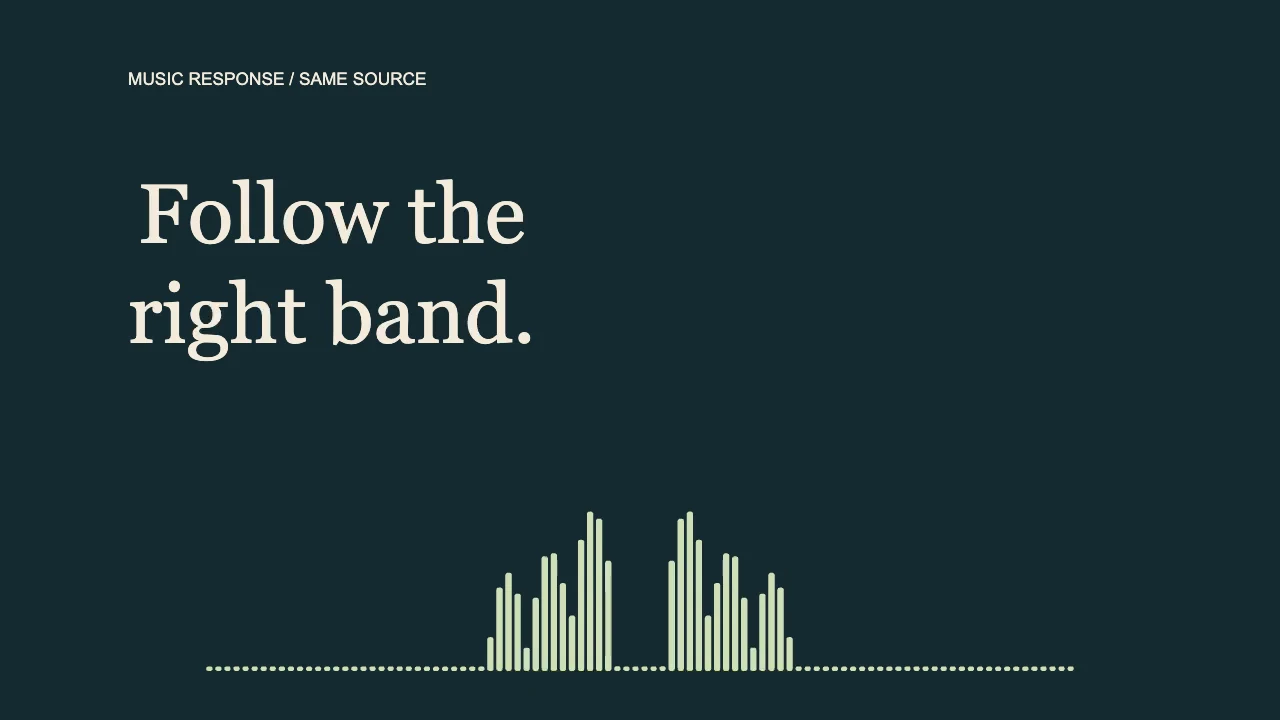
We made two four-second native exports from one private pulsed recording. Its main components were 110, 220 and 330 Hz. Both scenes used 96 bars, Standard response, Sensitivity 1, Movement 1 and Smoothing 0.5. We changed only the response target.
Highs selected: little frequency-driven movement
Highs follows 4,000–16,000 Hz. In this diagnostic recording, the selected frequency data was zero at the sampled moments. The baseline and small shared beat pulses can remain; near-flat bars do not prove playback stopped.
Full mix selected: the bars respond
The same source and composition with Full mix selected. Frequency-driven bars appear without replacing the file, boosting its audio level or changing the output format. Both public animations contain zero audio streams.
At 2.5 seconds, the highest selected frequency value changed from 0 in Highs to approximately 0.58 in Full mix on the renderer's normalized input scale. That is an internal display value, not a loudness measurement. The controlled source makes the cause clear; a full music mix may contain substantial energy in several bands.
Bass, Mids and Highs are frequency choices, not instrument isolation. Selecting Bass can respond to both a kick and a bassline. These controls change the visual response; they do not EQ the saved soundtrack. The waveform and spectrum guide explains the different displays.
Move smoothing away from its maximum for a test
If the correct band is selected but the bars remain almost flat, inspect Smoothing in a bars style that supports it. In the current bars renderer, a value of 1 retains the previous frequency response completely. Starting from zero, that can hold the frequency-driven heights at zero while small shared beat pulses remain.
In our check, the source still supplied frequency data with Smoothing at 1, but the bars' stored frequency response stayed at zero. Changing Smoothing to 0.5 allowed that response to update. This reproduced a different cause from selecting Highs on the low-frequency source.
Use 0.5 as a comparison value, then adjust to your music. Lower smoothing generally makes changes more immediate; more smoothing retains more of the previous state. It is a visual timing choice, not an audio repair. Keep Movement and Sensitivity steady while making this comparison.
Controls depend on the style. Waveform Ribbon uses the full mix and has no smoothing control in the contextual inspector. Do not search for a bars-only fix in a waveform style that does not offer it. Once the response works, the visualizer animation guide covers creative movement and composition.
When quiet audio barely moves the bars
First compare a quiet section with a stronger section of the same file. If only the quiet passage has little movement, keep Full mix selected and compare Sensitivity mode → Standard with Auto at the same source time. Then adjust Sensitivity gradually if the visual response still needs it.
We repeated the native analysis with a copy reduced by 24 dB. At 2.5 seconds, the highest selected display value was approximately 0.24 in Standard and 0.39 in Auto, with Sensitivity left at 1. Auto increased the response in this quieter example. Selecting Highs still returned zero for that source, even in Auto mode.
That gives a useful order: confirm the source and band first, then compare response modes. Auto cannot create music in a silent passage or supply frequency content missing from the selected band. It is also not a guarantee of identical movement throughout every song. Check the strongest section after an adjustment so the bars do not crowd the title.
A quiet passage does not need to fill the canvas. Nor must every bar bounce on every beat: a spectrum shows changing frequency content, and a sustained sound can produce a relatively steady shape. The bars can retain a small baseline during silence. Use the intended musical behavior as the test, rather than expecting every part of the display to reach zero.
Verify the result in a short saved video
Replay the same passage after changing one setting. Once the preview responds, save a short export and open that exact file to check the picture, soundtrack and timing together. Include a quiet-to-strong transition before committing to a full-song render.
Our comparisons used the actual VisualizerWave analyzer, scene renderer, audio store and Fast MP4 exporter in an isolated desktop Chromium test view on November 3, 2026. The two public examples are 1280 × 720, 30 fps and 120 frames each. We also changed the real Music response component from Highs to Full mix and verified the resulting native frame. This was a short diagnostic reproduction, not a full editor session, phone export or calibrated spectrum-analyzer test.
If the same passage still fails, keep the source file and note the browser, selected style, response mode, frequency target and whether the playhead advances. Record whether the problem occurs in the preview, saved video or both. Those details help separate a response setting from an import, playback or export failure.
For the complete workflow, use the audio visualizer creation tutorial. VisualizerWave is $19 once, with unlimited exports; see access and pricing.